AWS Lambda Cold Starts with Java, NodeJS, and DynamoDB
Introduction
AWS Lambda and DynamoDB go together like serverless peanut butter and jelly -- if you want a fully pay-per-use, elastically scaling, low-maintenance application, it's hard to beat these two working together (with API Gateway as the bread, or something, to complete the sandwich).
But I have a problem: I like to write code in Java. As many readers may already know, Java lambda functions have issues with cold starts. But simply adding a call to Dynamo can make it much worse.
While researching how to optimize AWS Lambdas written in Java, I came across this git issue, asking why cold start performance is so much worse when calling AWS Dynamo from a Java lambda. One of the major conclusions I got from this is that the Java runtime's initialization step itself is not the problem; instead, creating the AWS SDK Dynamo client and making the first call to Dynamo increases the time of the cold start by an order of magnitude.
This piqued my curiosity. In some of my side projects, I had written NodeJS Lambdas that made calls to Dynamo, and the cold start performance had been tolerable -- less than a second. So I wanted a fine-grained comparison of cold start performance between Java and NodeJS lambdas that used DynamoDB. I googled looking for a blog post or resource diving into cold starts due to Dynamo -- but most of what I found seemed content to compare "Hello World" type use cases.
So I decided to run my own tests and write this post to provide data for anyone who is also interested in Lambda + Dynamo performance.
Here's a sample of my findings:
- For a Java 11 Lambda function set with 1024 MB of memory, a single PutItem to Dynamo increased the average cold start time from 378ms to 3719ms.
- For a Node 12 Lambda function, also 1024 MB, a single PutItem call to Dynamo increased the average cold start time from 150ms to 324ms.
This is also something of a TL;DR: in all of my tests, NodeJS outperformed Java across the board. It even has slightly better p50 performance when the container is warm. I invite you to read on to see how I got these numbers, and to see summary statistics across multiple memory levels.
The Methodology
For each language, I wrote two lambda handlers:
- A "Hello World" handler, to get a baseline difference. It just logs the string "hello world."
- A "PutTodoHandler" that calls PutItem to write a dummy "Todo" item to Dynamo, with a randomly generated UUID as the partition key.
The git repos are available here:
A special note on the PutTodoHandler written in Java: I used almost every optimization mentioned in this aws blog post on tuning Java lambdas, and this presentation from Re:Invent 2019. Here is a summary of the optimizations:
- Use the AWS SDK v2 Dynamo client
- Initialize the Dynamo client in the Handler class constructor
- This creates the Dynamo client during the function's initialization phase
- Use the
EnvironmentVariableCredentialsProviderin the client builder - Get the region from the lambda's environment variables in the client builder
- Specify the Dynamo endpoint in the client builder
- Use the
UrlConnectionHttpClientin the client builder - Add exclusions for
netty-nio-clientandapache-clientin the Pom - Use the "low level" DynamoDB request objects (I did not use the new enhanced client, which basically replaces the v1 DynamoMapper).
For each lambda, I ran the following bash script from my laptop.
#!/usr/bin/env bash

memorySizes="256 512 1024 1536 2048 2560 3008"

functionName=$1
if [[ -z $functionName ]]; then
  echo "USAGE: test-cold-starts.sh <function_name>"
  exit 1
fi

for i in {1..50}
do
  for memorySize in $memorySizes
  do
    echo "iteration=$i memory=$memorySize"

    echo "Updating $functionName"
    aws lambda update-function-configuration --function-name $functionName --memory-size $memorySize > /dev/null

    echo "Wait five seconds ..."
    sleep 5

    echo "Invoking the lambda"
    aws lambda invoke --function-name $functionName --payload "{}" ./lambda-response.json > /dev/null

    echo "Wait one second ..."
    sleep 1
  done
done
The script iterates through each memory setting I want to test, and calls update-function-configuration to change the lambda's configured memory, which is also how I ensure the next invocation is a cold start: any time you change the lambda's configuration, it throws away any warm containers with the previous configuration.
Lambda already logs all the data I need in CloudWatch. The "InitDuration" is the time taken for the "initialization" phase of setting up the container, and the "Duration" is the actual execution time of the handler function. A full cold start is the sum of those two durations. To calculate my summary statistics for each test run, I ran a simple query in CloudWatch Insights. Insights even has a convenient option to export to a Markdown table, making it easy to paste directly into my post!
fields
@timestamp,
@initDuration,
@duration,
@initDuration + @duration as total,
@billedDuration,
@memorySize/1000000 as memory
| sort @timestamp desc
| filter @initDuration > 0
| stats count(*) as count,
avg(total) as average,
pct(total, 50) as median,
stddev(total) as stddev,
min(total) as min,
max(total) as max,
avg(@duration) as avgDuration,
avg(@initDuration) as avgInitDuration
by memory
| sort memory
Hello World Cold Starts
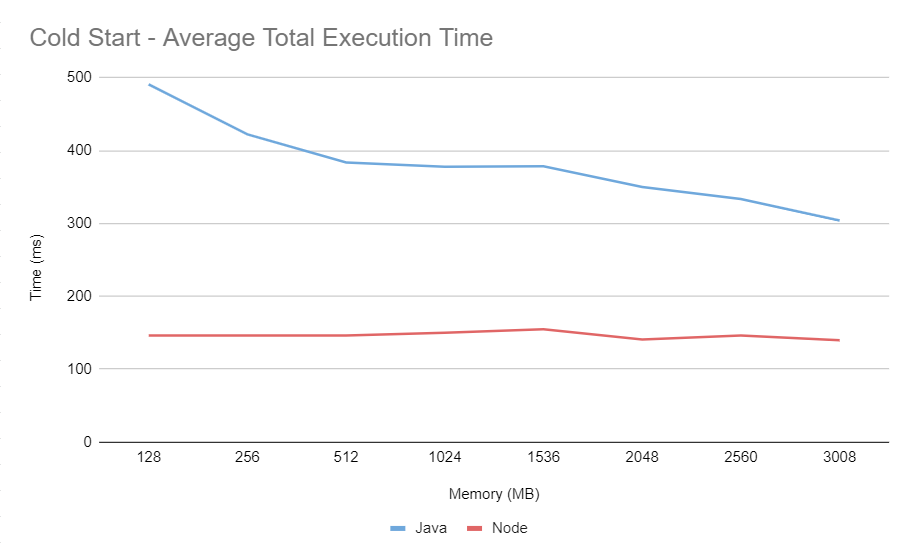
First, we start with Hello World lambdas to establish a baseline between the two language runtimes. I only collected about 10-20 data points per memory size. As expected, NodeJS has a shorter cold start time, but both start under 500ms even at 128 MB of memory.

Before moving on, I want to take a moment to call out that the folks at AWS Lambda have done a tremendous job over the years to reduce cold start times for all languages, and especially Java. In this blog post by Nathan Malishev from 2018, the author compares "Hello World" functions across different languages, including Java and NodeJS, so we can do a rough apples-to-apples comparison of cold start times against the stats I have collected.
At 128 MB, Java's cold start was 1.25 seconds (compared to the 491ms average I got), and at 3008 MB, the cold start was 718ms (compared 304ms). You can also see the trend of improvement in the same author's follow up blog post written in 2019, where Java's cold start was 670ms at 128 MB, and 479ms at 3008 MB.
I predict that the Java language cold start times will continue to improve. But as we will see shortly, the language itself isn't the only cause for performance issues.
NodeJS Cold Start Stats
| memory | count | average | median | stddev | min | max | avg duration | avg init duration |
|---|---|---|---|---|---|---|---|---|
| 128 | 18 | 149.95 | 145.5 | 12.33 | 130.42 | 178.9 | 8.80 | 141.14 |
| 192 | 1 | 141.58 | 141.58 | 0 | 141.58 | 141.58 | 2.37 | 139.21 |
| 256 | 16 | 146.81 | 145.97 | 12.41 | 129.51 | 179.84 | 2.44 | 144.37 |
| 512 | 17 | 150.79 | 145.98 | 18.48 | 123.3 | 197.54 | 2.99 | 147.79 |
| 1024 | 16 | 148.72 | 145.85 | 16.66 | 124.19 | 196.76 | 2.36 | 146.35 |
| 1536 | 16 | 149.32 | 147.75 | 17.44 | 128.46 | 202.67 | 2.81 | 146.50 |
| 2048 | 16 | 143.21 | 141.86 | 10.42 | 128.92 | 170.48 | 2.33 | 140.88 |
| 2560 | 10 | 146.28 | 145.17 | 10.11 | 129.3 | 165.77 | 2.38 | 143.89 |
| 3008 | 10 | 139.79 | 137.23 | 9.08 | 122.71 | 153.5 | 2.26 | 137.53 |
Java Cold Start Stats
| memory | count | average | median | stddev | min | max | avg duration | avg init duration |
|---|---|---|---|---|---|---|---|---|
| 128 | 13 | 486.84 | 485.32 | 21.21 | 451.63 | 522.31 | 118.49 | 368.35 |
| 256 | 14 | 415.80 | 413.22 | 23.55 | 394.1 | 489.7 | 48.91 | 366.89 |
| 512 | 14 | 384.22 | 379.03 | 35.42 | 347.39 | 502.05 | 18.89 | 365.33 |
| 1024 | 11 | 377.22 | 371.02 | 21.93 | 345.02 | 418.39 | 7.87 | 369.34 |
| 1536 | 11 | 376.33 | 370.18 | 24.20 | 343.49 | 432.05 | 7.67 | 368.66 |
| 2048 | 11 | 348.71 | 334.41 | 22.95 | 329.37 | 389.15 | 7.49 | 341.22 |
| 2560 | 10 | 333.53 | 309.03 | 46.85 | 299.77 | 451.92 | 7.64 | 325.89 |
| 3008 | 10 | 304.00 | 292.96 | 26.25 | 276.02 | 370.72 | 7.76 | 296.23 |
Cold Starts Writing Item to Dynamo Table
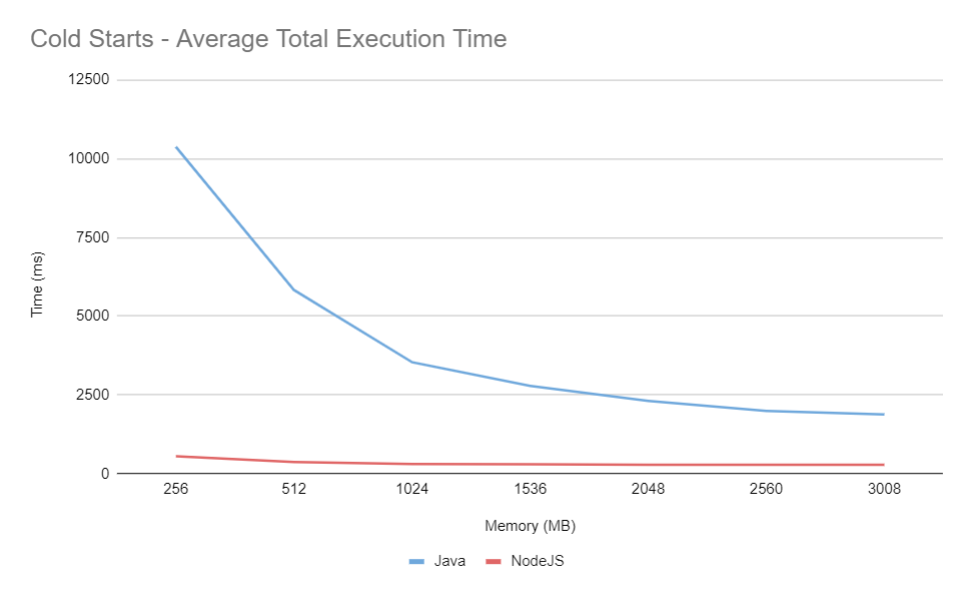
With a "Hello World" lambda handler, Java took about 2-3x longer to cold start than NodeJS, based on the memory setting. But once you add a call to DynamoDB, you are looking at a 6-10x difference. At any memory setting greater than 256 MB, NodeJS can handle the cold start in about half a second. With Java, at the max memory setting, the least you can hope for is 2 seconds.

There are at least two causes for this explosion in cold start time (both of which are explained in more detail in this Re:Invent talk):
-
Initializing the Dynamo SDK is expensive, due to loading a large number of classes, and setting up the thread pool for the http client, etc.
-
The SDK uses Jackson to marshall/unmarshall errors and data (using reflection, which is highly time-consuming), and lazy-initializes these classes on the first API call.
The impact of this is evident in the data. When configured with 256 MB of memory, Java needed 1418ms on average in the initialization phase, and then a whopping 8952ms to execute the handler. The handler's execution time improves considerably as memory (and allocated CPU) increases.
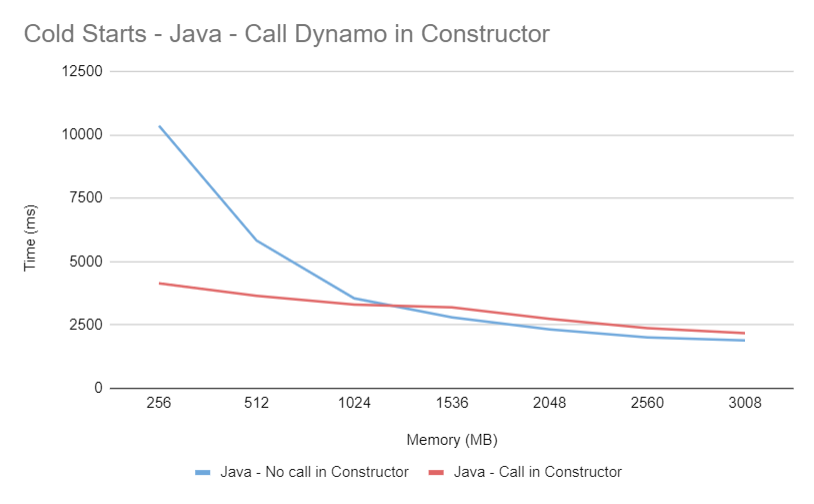
Now, in that Re:Invent talk I linked above, the presenter mentions another optimization I did not include in this test run, which is to make a call to Dynamo during the initialization phase. I ran a separate test with that optimization, and the results I got were interesting. We're going to cover that in a bit.
Node Cold Start Stats
| memory | count | average | median | std dev | min | max | avg duration | avg init duration |
|---|---|---|---|---|---|---|---|---|
| 128 | 51 | 918.71 | 917.66 | 42.64 | 842.43 | 1103.26 | 699.23 | 219.47 |
| 256 | 53 | 560.77 | 558.47 | 21.15 | 517.82 | 648.84 | 340.55 | 220.22 |
| 512 | 51 | 381.30 | 383.59 | 19.34 | 340.24 | 430.80 | 159.61 | 221.69 |
| 1024 | 52 | 315.33 | 313.29 | 20.39 | 271.92 | 397.59 | 91.28 | 224.04 |
| 1536 | 50 | 305.32 | 301.53 | 34.37 | 268.04 | 501.26 | 74.51 | 230.81 |
| 2048 | 51 | 290.48 | 283.72 | 24.00 | 257.26 | 392.37 | 69.25 | 221.23 |
| 2560 | 51 | 289.38 | 284.91 | 18.01 | 261.87 | 336.65 | 69.24 | 220.14 |
| 3008 | 50 | 291.49 | 280.54 | 51.80 | 251.41 | 604.80 | 70.88 | 220.60 |
Java Cold Start Stats
At 128 MB, the lambda would timeout or throw an OOM exception, so I skipped that memory level.
| memory | count | average | median | std dev | min | max | avg duration | avg init duration |
|---|---|---|---|---|---|---|---|---|
| 256 | 51 | 10371.53 | 10533.26 | 971.84 | 4161.55 | 11419.42 | 8952.74 | 1418.79 |
| 512 | 50 | 5835.57 | 5881.51 | 291.31 | 5053.68 | 6368.57 | 4460.91 | 1374.65 |
| 1024 | 50 | 3542.44 | 3545.83 | 144.15 | 3170.33 | 3819.56 | 2167.52 | 1374.92 |
| 1536 | 50 | 2793.15 | 2785.89 | 86.97 | 2610.71 | 2998.52 | 1410.33 | 1382.81 |
| 2048 | 50 | 2313.93 | 2313.97 | 97.61 | 2052.01 | 2662.74 | 1076.61 | 1237.31 |
| 2560 | 50 | 2000.56 | 2008.79 | 65.74 | 1812.92 | 2138.11 | 917.90 | 1082.65 |
| 3008 | 50 | 1884.56 | 1879.73 | 63.44 | 1733.43 | 2144.45 | 836.32 | 1048.23 |
Performance of Warm Containers Writing Item to Dynamo
Cold starts are only one consideration for lambda latency -- and honestly, a small one at that. In any application with consistent traffic, they will constitute a small overall percentage of invocations. So what about the performance for the other 99.99% -- when the container is warm?
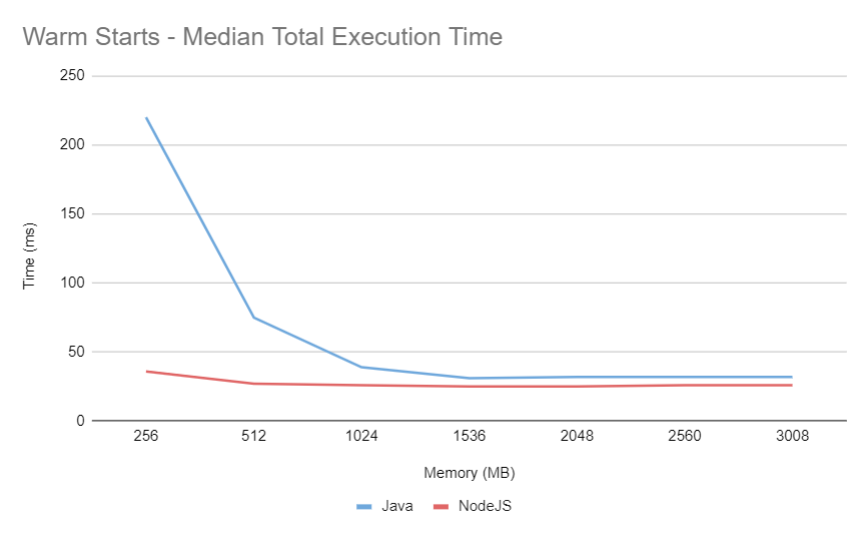
I wrote a second script that configured the lambda memory setting and then invoked it 50 times with a one-second pause between each call. Then I used another Insights query which ignored cold starts. NodeJS still has the advantage in making calls to DynamoDB. Once the Java memory is 1536 MB or more, it comes close, but still consistently behind NodeJS. This result surprised me -- I had expected that once warmed, the power of the JVM would allow Java to execute this code faster. This is not enough to conclude superiority of NodeJS over Java in warmed containers -- but in terms of writing items to Dynamo, it seems to have the edge.

NodeJS Warm Start Stats
| memory | count | average | median | stddev | min | max |
|---|---|---|---|---|---|---|
| 128 | 50 | 76.91 | 57.31 | 61.69 | 26.00 | 312.41 |
| 256 | 50 | 41.84 | 36.34 | 27.89 | 21.08 | 147.41 |
| 512 | 49 | 29.65 | 26.69 | 15.72 | 18.95 | 125.83 |
| 1024 | 59 | 26.46 | 26.33 | 5.31 | 11.15 | 43.53 |
| 1536 | 49 | 24.97 | 25.49 | 3.59 | 16.16 | 32.76 |
| 2048 | 50 | 25.30 | 24.70 | 4.38 | 18.81 | 44.93 |
| 2560 | 49 | 26.37 | 26.20 | 3.34 | 20.26 | 35.36 |
| 3008 | 49 | 27.64 | 26.11 | 8.85 | 12.93 | 69.90 |
Java Warm Start Stats
| memory | count | average | median | stddev | min | max |
|---|---|---|---|---|---|---|
| 256 | 62 | 312.46 | 219.93 | 203.02 | 121.57 | 1050.61 |
| 512 | 50 | 101.52 | 74.72 | 71.37 | 29.14 | 363.98 |
| 1024 | 51 | 50.86 | 39.12 | 35.01 | 25.19 | 204.83 |
| 1536 | 50 | 37.81 | 30.99 | 20.45 | 17.93 | 119.51 |
| 2048 | 50 | 37.37 | 31.56 | 19.74 | 17.02 | 112.78 |
| 2560 | 51 | 37.65 | 32.28 | 16.51 | 17.42 | 93.18 |
| 3008 | 52 | 36.14 | 32.44 | 17.56 | 17.99 | 112.27 |
Insights Query
fields
@timestamp,
@initDuration,
@duration,
@billedDuration,
@memorySize/1000000 as memory
| sort @timestamp desc
| filter @type == "REPORT" and not ispresent(@initDuration)
| stats count(*) as count,
avg(@duration) as average,
pct(@duration, 50) as median,
stddev(@duration) as stddev,
min(@duration) as min,
max(@duration) as max
by memory
| sort memory
What about calling Dynamo in the initialization phase?
As alluded to earlier, one possible optimization for improving Java cold starts is to make your first Dynamo call in the initialization phase. The reasoning here is that during this phase, the container is given a boost of CPU which speeds up the lazily initialized class loading and reflection the Dynamo client executes on its first remote call. In the GitIssue that inspired this whole thing, a commenter mentions using "DescribeTable" to accomplish this -- so I just used that.

The results are interesting. Clearly it improves cold start performance for the lower memory ranges, but then for each memory setting above 1024 MB, the duration is slightly worse. This makes me wonder if that "CPU boost" only applies to those lower memory settings. Perhaps this technique is useful for those who want to run at a lower memory setting (perhaps to save cost).
A word of warning: the initialization phase must complete within 10 seconds, or the lambda will fail with a timeout. Be careful packing too much into this step.
Java Cold Start Stats (with Dynamo Call in Initialization Phase)
| memory | count | average | median | stddev | min | max | avg duration | avg init duration |
|---|---|---|---|---|---|---|---|---|
| 256 | 50 | 4137.37 | 4089.67 | 229.89 | 3745.83 | 5062.00 | 1311.94 | 2825.42 |
| 512 | 51 | 3643.88 | 3687.50 | 209.29 | 3194.06 | 4018.13 | 685.47 | 2958.40 |
| 1024 | 51 | 3295.67 | 3313.25 | 166.59 | 2903.14 | 3657.54 | 329.99 | 2965.67 |
| 1536 | 50 | 3184.67 | 3206.85 | 135.29 | 2856.50 | 3412.22 | 242.89 | 2941.78 |
| 2048 | 50 | 2732.93 | 2785.92 | 189.13 | 2300.08 | 3028.60 | 180.61 | 2552.32 |
| 2560 | 50 | 2367.50 | 2380.64 | 145.84 | 1998.86 | 2781.30 | 158.43 | 2209.06 |
| 3008 | 51 | 2166.97 | 2162.84 | 101.02 | 1996.10 | 2617.83 | 142.36 | 2024.60 |
Conclusions
After spending the time to do research, run these experiments, analyze the data, and write all this out, I have reached a strengthened conclusion that for many use cases, cold starts don't matter. For a synchronous request/reply service that receives any steady traffic, cold starts probably won't impact p99 latency to a large degree (maybe not even p99.9). If you have asynchronous or event-triggered functions, cold starts shouldn't be a concern at all. Jeremy Daly has a great blog post which goes into this in more detail. Cold starts are a technical detail that some engineers get too hung up on -- some may blind themselves with tunnel vision, losing sight of the fantastic benefits of AWS Lambda (or FaaS, in general) that greatly outweigh this issue. I know, because I have been guilty of this -- after all, I just wrote this 3000 word blog post!
But if you can't move on from them, or if you have a use case where cold starts do matter, what do you do?
It would seem the simplest way to ensure optimal performance with Lambda and Dynamo is to write your functions in NodeJS (or another language with favorable cold start performance, like Golang or Python). If you and your team are willing to embrace that language and its eco-system of libraries, test frameworks, and idiosyncratic quirks (hey, no language is perfect), then this should be your first consideration.
If you need to (or want to) use Java, use every optimization available to reduce cold start time, and then select one of these options:
- Use provisioned concurrency with an auto scaling policy.
- Try rigging up your own periodic warmer solution (this might save costs over provisioned concurrency, but you need to factor in the total cost of ownership in terms of setting up and maintaining the warmers).
- Look into compiling your Java Lambda into a native image with GraalVM -- possibly with a framework like Quarkus. This blog post by AWS experimenting with Quarkus shows very promising results. They seem to be able to get cold starts down to one second with a 256 MB Java lambda function making calls to Dynamo.
- Use a container based solution, like Fargate.
Perhaps someone will read this post and wonder, why would anyone use Java in a lambda?
If I have a team (or organization) composed of seasoned Java developers, and if we want to write applications using Lambda, then I need to weigh the costs of re-training everyone in a new language. And that's not just a new syntax (which can be learned in a few days) -- it's a new set of best-practices, new frameworks, new test libraries and habits, new build tools, new development tools and environments, new concurrency tools, new libraries and dependencies, new sources of mistakes and bugs, a new way of thinking about problems and solutions. I need to weigh all that against the cost of just using one of the solutions above to handle cost starts. Would I rather have each of my engineers exert some amount of effort re-training themselves in that new eco-system, or devote that effort towards rapidly delivering new features for our customers?
As a final note, I'm intrigued in option #3 in the list above. What would the performance look like if I ran my experiment with a lambda in a native runtime compiled by Quarkus? I think I may follow up with another blog post soon.